Monitoring
Monitoring CI/CD pipelines helps ensure that they run smoothly and efficiently. It allows you to detect and resolve issues early, track pipeline performance, and maintain high-quality code.
Setting Up Basic Monitoring in GitLab CI/CD
-
Step 1: Enabling Pipeline Monitoring
-
Step 2: Adding Notifications for Pipeline Events
-
Step 3: Using GitLab’s Built-In Monitoring Tools
GitLab provides several built-in tools for monitoring your CI/CD pipelines and applications.
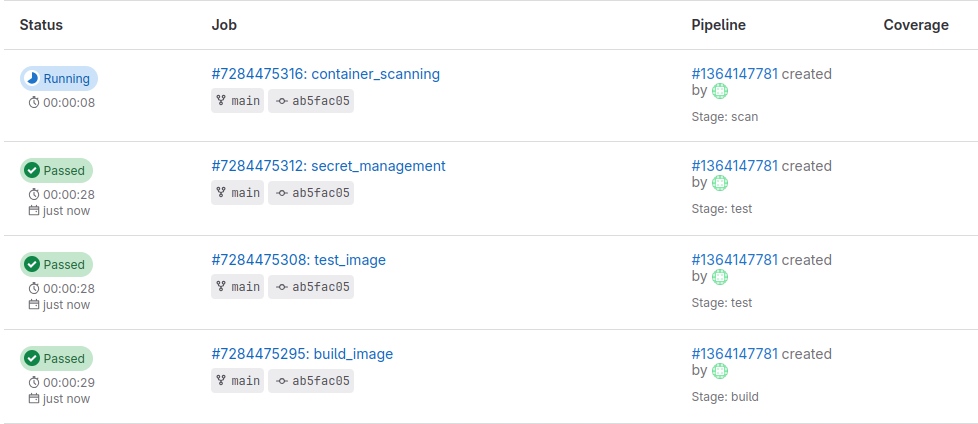
1. Job Logs:
- Each CI/CD job generates logs that you can view in the GitLab interface.
- To view job logs:
- Go to
Build>Pipelinesin your GitLab project. - Click on a pipeline to view its details.
- Click on a job to view its logs.
- Go to
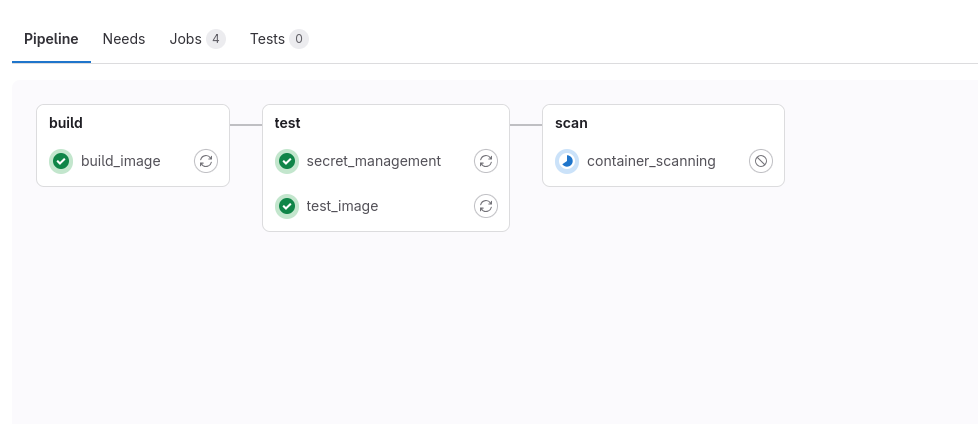
2. Pipeline Graph:
- The pipeline graph visualizes the stages and jobs in your pipeline, making it easier to understand the flow and dependencies.
- To view the pipeline graph:
- Go to
Build>Pipelinesin your GitLab project. - Click on a pipeline to view its details.
- The pipeline graph will be displayed at the top of the page.
- Go to
Practical Exercise:
1. Set Up Pipeline Schedules:
Create a pipeline schedule to run tests every night.
2. Configure Email Notifications:
Set up email notifications for pipeline events. Integrate Slack with GitLab to receive pipeline notifications in a Slack channel.
3. Explore Pipeline Analytics:
Review the pipeline analytics for your project and identify areas for improvement.
4. View Job Logs and Pipeline Graph:
Explore the job logs and pipeline graph for a recent pipeline run. By following these steps and examples, you can set up basic monitoring for your GitLab CI/CD pipelines, ensuring you stay informed about the status and performance of your workflows.